Introduction
Elections are important
Elections are important. Through them, we decide whom we allow to make decisions on our behalf – who will run the country, the economy, our foreign and defence policies and the National Health Service, as well as those responsible for our schools and local services. This is fundamental to democracy.
Choosing the right people is a serious matter.
In the UK, we have several tiers of government – ranging from parish councils to the Parliaments at Westminster and in Europe. For each tier, there are elections at which all eligible registered adults have the chance to cast a vote. But the way in which we vote, and the voting system we use, can make a big difference to the outcome. Choosing one system rather than another can affect who is in power and therefore what happens in every aspect of policy.
Several different voting systems are already being used in the UK, but most of our elections, including general elections, use a system known as First Past the Post (FPTP). FPTP, however, is far from perfect, particularly in the multi-party environment that the UK is increasingly becoming. Changing the voting system from FPTP is therefore on the public agenda.
This leaflet is about a much better alternative – the Single Transferable Vote system.
Why change from first past the post?
Consider how Members of Parliament are elected using FPTP. The country is divided into 659 constituencies and in each the candidate with the most votes wins. That might seem simple, but it does not follow that it is fair. Here are some of the problems:
- With FPTP candidates can win even if they do not have an overall majority of the votes cast. As a result, governments are almost always elected even though a majority of voters have supported opposition parties. In the 2001 General Election, Labour was re-elected with well over half the seats – an overall majority of 165 seats –despite getting only 40 per cent of the national vote.
- The situation was not unique to that election – no government since 1935 has got more than 50 per cent of the vote.
- While some parties get many more seats than could be justified by their share of the vote in FPTP elections, many others get fewer seats than what might be regarded as their share.
- FPTP consistently wastes about half of the votes that are cast. Around half of those who voted do not have an MP for whom they voted, and consequently often feel that they are not being properly represented.
- With FPTP voter choice is limited to just a single candidate for each party in each constituency. Voters have to put up with whatever candidate the party offers them. They cannot choose between different candidates from the same party who might offer different skills or come from different backgrounds.
These are some of the reasons why many people want to change from FPTP to something better. Of course, the system used to elect the House of Commons is the most difficult to change because the only people who can change it (MPs) are also the ones who might feel they would lose out in any change.
STV – the best alternative
There are a number of different alternatives to FPTP, some of which are already being used in the UK. The best is called the Single Transferable Vote (STV).
STV is used in Northern Ireland for all elections except Westminster and will be used for local elections in Scotland. It uses ‘preferential’ voting in constituencies electing a number of members – instead of voting with an ‘X’, electors cast their ballot by numbering the candidates in order of preference – 1,2,3 and so on.
Candidates don’t need a majority of the votes to be elected, just a known ‘quota’ or share of the votes, allowing minority viewpoints to be represented.
Because voters are able to rank all the candidates in order of preference, few votes are wasted, unlike in FPTP elections
How does STV work?
The Vote
- The ballot paper lists the names of the candidates from each party. Voters vote by putting a ‘1’ next to the name of their favoured candidate, a ‘2’ next to the name of their next favoured candidate and so on. They stop allocating preferences when they cannot decide between the candidates – they do not need to vote for them all.
- At the count, the number of votes which candidates need in order to be elected (the ‘quota’) is calculated by dividing the total number of valid ballot papers by the number of people to be elected plus one. For example, with 100 valid ballot papers and 3 places to be filled, the quota would be 25.
- The ballot papers are sorted into piles according to the first preferences – the ‘1’s. If any candidate has more first preference votes than the quota, they are immediately elected.
- The next stage is to transfer any surplus votes for these elected candidates, i.e. the difference between their vote and the quota needed to be elected. To avoid the problem of deciding which of the votes are surplus, all ballot papers are transferred but at a reduced value so that the total adds up to the number of surplus votes.
- After all the surpluses have been transferred, we look to see whether all the places to be elected have been filled. If they have not, then the candidate with the fewest votes is excluded and his or her votes are transferred to the voters’ second preferences.
- This process of transferring surpluses and excluding candidates continues until enough candidates have reached the quota to fill all the places to be elected.
Although the counting process is more complex than with FPTP, it can be done by, or with the help of, a computer and it is a small price to pay for improving the voting power of every single elector.
Example Election
Election Result Sheet
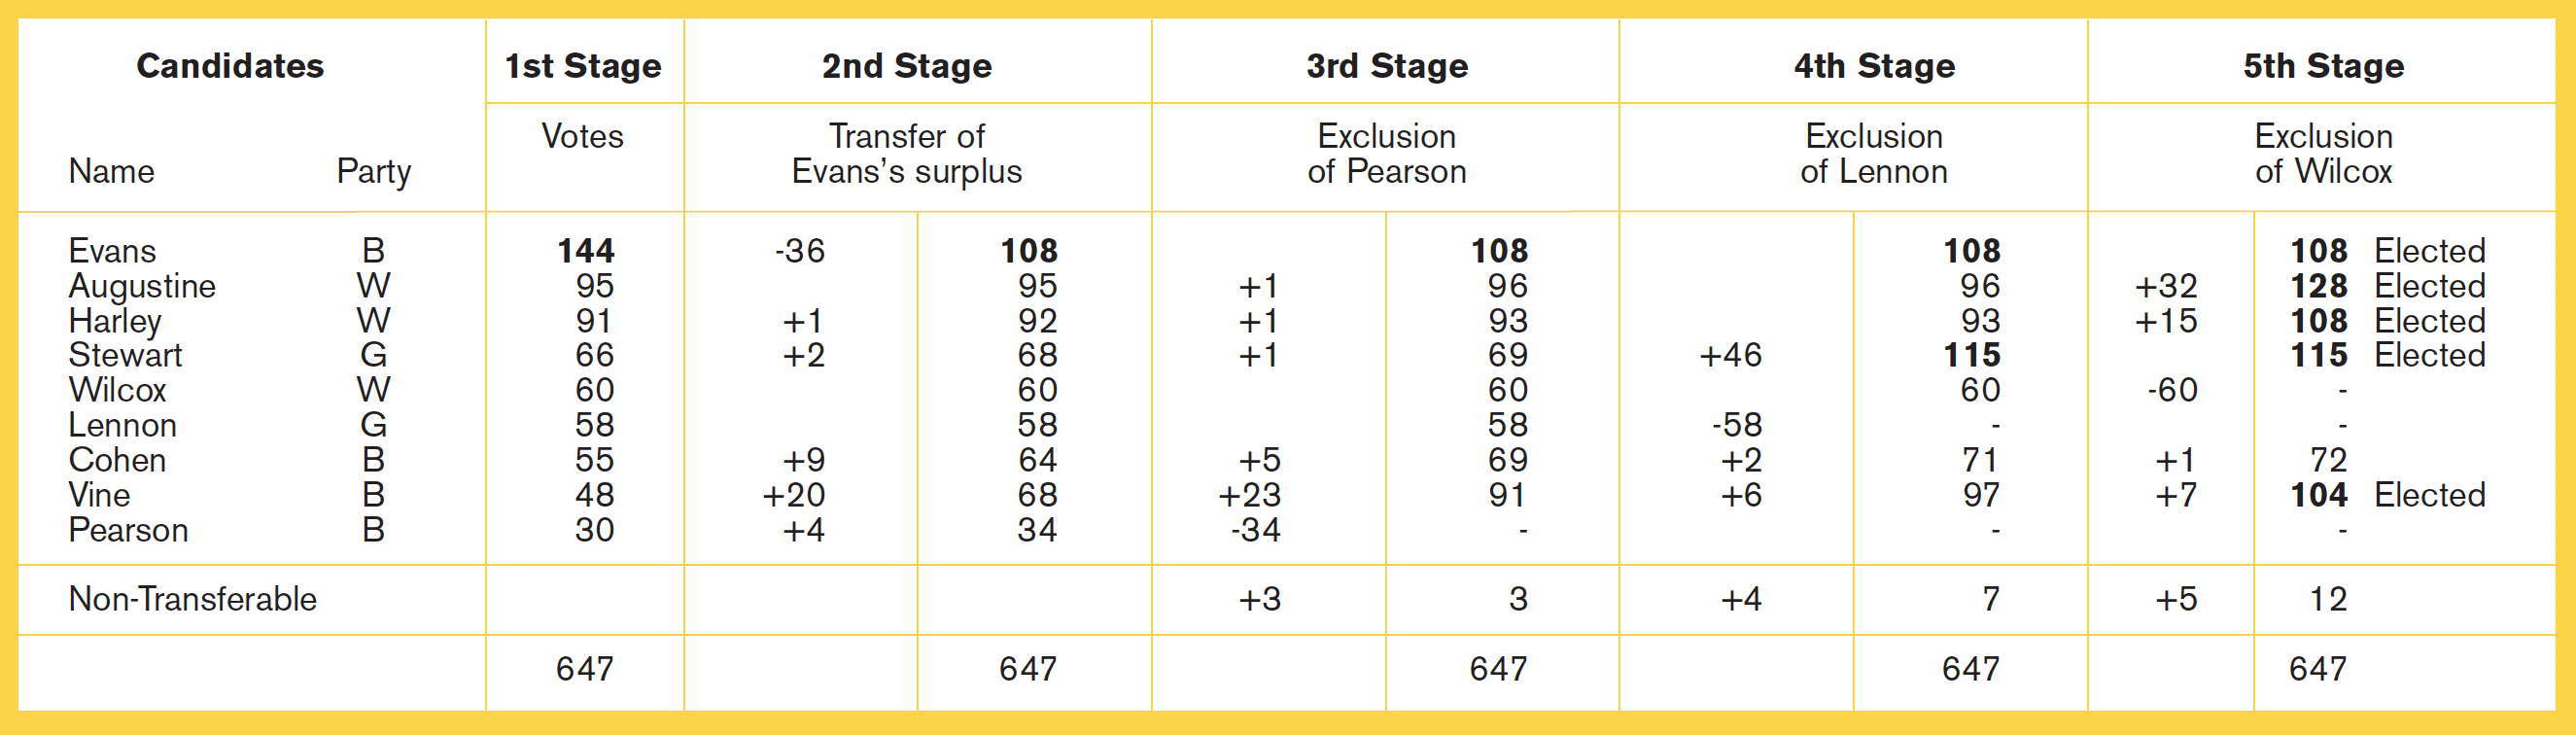 Number of valid votes: 647 | Number of seats: 5 | Quota: 647/5+1 = 108
Counting the Votes
The Returning Officer sorts the ballot papers according to the candidate marked as first preference, i.e. marked with the figure 1. In the course of this sorting, any papers incorrectly marked will come to light and will be set aside as invalid. The Returning Officer enters the total number of first preference votes for each candidate on the result sheet in the column headed ‘First Stage’. The total of this column gives the number of valid votes cast.
In our illustrative election, the first candidate has 144 votes, the fifth candidate only 60. Simply to elect the first five candidates with their unequal support would be inequitable and would leave unrepresented those who had voted for the remaining candidates. It would give the Working, Birthday and Garden Parties, with 246, 277 and 124 preferences respectively, three, one and one seats.
Deciding the quota
As this is a Single Transferable Vote election, a successful candidate needs to poll not a majority, but a minimum number of votes that guarantees election. This is called the quota. To calculate this quota, the Returning Officer divides the total of the valid votes by one more than the number of members to be elected and rounds the result up to the next highest whole number. Thus in a three- member constituency the quota would be just over one quarter of the total vote because only three candidates can each poll this figure, leaving less than a quota of votes for all the other candidates combined.
In this election the total valid vote is 647 and there are five members to be elected. 647 is divided by six (5+1) to give a quota, rounded up to the next whole number, of 108. Only five candidates can each poll 108 votes out of a total of 647.
One candidate, Evans, has 144 votes. This exceeds the quota of 108 and the Returning Officer declares Evans elected. This completes the first stage.
Transfer of Evans’s surplus
The Returning Officer’s next duty is to transfer the surplus votes over and above the quota, if there are any. Of his 144 votes, Evans must keep 108 for his quota, leaving 36 surplus votes to be transferred in such a way as to reflect the wishes of all his supporters as to their next choices. The Returning Officer now re-sorts all Evans’s 144 papers according to the names of the candidates marked on them as second preferences.
| The re-sorting of Evans’s papers shows that: |
|
| Vine (same party) is second choice on |
80 papers |
| Cohen (same party) is second choice on |
36 papers |
| Pearson (same party) is second choice on |
16 papers |
| Stewart is second choice on |
8 papers |
| Harley is second choice on |
4 papers |
|
144 papers in all |
Evans can spare 36 out of his 144 votes (i.e. 144, less the quota of 108) – that is, one out of every four votes. Each one of these five candidates is therefore entitled to one-fourth of the number of papers in which he or she is the next preference. But taking one paper in every four at random will involves some ele- ment of chance. The more correct way is to avoid chance by transferring not one paper in four, but all of Evans’s papers, each at the reduced value of one quarter (0.25) of a vote.
These are accordingly transferred, as set out in the result sheet in the column head- ed ‘Second Stage’. Vine receives 80 x 0.25 = 20 votes, and so on. The resulting figures are added to the first preferences to give the new totals shown.
Exclusion of Pearson
Pearson has the fewest votes (34) and is now excluded. His 30 papers of full value are transferred to second preferences (or third preferences, in the case of any paper showing Evans – already elected – as second choice) and then the 16 papers of reduced value (0.25) are similarly transferred. Vine and Cohen receive the equivalent of 23 and 5 votes respectively; Augustine, Harley and Stewart each receive one vote (or the equivalent in reduced-value papers of one vote). The equivalent of three votes show no further preferences (or shows pref- erences only for Evans, already elected) and so become non-transferable. They are entered as such on the result sheet under the column ‘Third Stage’, which shows the new totals for each candidate still in the running. This completes the third stage.
Exclusion of Lennon
Lennon now has fewest votes (58); Evans is still the only candidate to have reached the quota and been declared elected. So the next stage is to exclude Lennon. 46 of the 58 voters who put her first have shown as the next available preference (ignoring preferences for candidates already elected or excluded) another candidate for the same party, Stewart; six have crossed party lines to support another woman, Vine; two show Cohen as the next available prefer- ence; four show no further available preference and become non-transferable.
The new totals are again added up (‘Fourth Stage’ column), and we see that Stewart now has 115 votes and has therefore passed the quota (108). The Returning Officer accordingly declares Stewart elected.
Exclusion of Wilcox
At first sight, the next thing to do might appear to be to transfer the surplus Stewart now has. But his surplus (7) is smaller than the difference between the two candidates with the fewest votes, Wilcox (60) and Cohen (71) and thus cannot affect the order between them. So instead, the Returning Officer now excludes the lowest candidate, Wilcox. Most of her 60 votes go to the two other candidates of her party (32 to Augustine and 15 to Harley). Seven of them go to the other woman still in the running, Vine. One vote goes to Cohen, and five show no further available preference and so become non-transferable.
The Returning Officer examines the new totals (‘Fifth Stage’ column) and sees that Augustine now exceeds the quota of 108, and that Harley has just attained it. These two candidates are therefore declared elected.
The combined surplus now achieved by Augustine (20 surplus) and Stewart (7 surplus) are not enough to make any difference to the order of the two remaining candidates, Cohen (72) and Vine (104). So there is nothing to be gained by transferring them. The Returning Officer is therefore able straight away to declare Cohen excluded, and the one remaining candidate, Vine, is deemed to be elected despite not having quite reached the quota. This completes the count.
Result
The five elected candidates are nearly equally supported, and 563 out of 647 voters, or 87% of those who voted, contributed to their election. The Birthday, Garden and Working Parties with 277, 124 and 246 first preferences, have two, one and two seats respectively, those elected being the preferred candidates of their respective groups. Only 84 votes out of 647 have not helped elect a repre- sentative, compared with about half at typical British elections. Even those 84 have, among the elected members, one who belongs to a party they support.
It will be noted that, after the count has been completed, the five candidates elected are not the same five as received the five largest first preference votes (see result sheet). This is mainly because a party’s votes accumulate on its most popular candidates.
Analysis of Result
| Party |
No. of candidates |
First preferences |
Seats won |
| Working |
3 |
246 |
2 |
| Birthday |
4 |
277 |
2 |
| Garden |
2 |
124 |
1 |
|
9 |
647 |
5 |