Foreword
By Katie Ghose
Last year’s Northern Ireland Assembly election saw some fascinating developments. From a 50% increase in women’s representation, to the growth of cross-community parties and some surprise upsets, it was testament to an evolving democracy, under a voting system that allows voters’ diverse views to be represented.
For the Electoral Reform Society (ERS) it was particularly interesting to watch, as an organisation with a long history in Northern Ireland. It was the Proportional Representation Society of Great Britain and Ireland (later to become the ERS) who successfully lobbied for the introduction of the Single Transferable Vote in both parts of the island after partition in 1920.
And from 1960-1980, Enid Lakeman, the Society’s Director at that time, was a highly effective advocate for STV in Ireland – North and South – with the ERS playing a key role in winning two referendums to keep STV in the Republic (in 1959 and 1968). Later, then Taoiseach Garret Fitzgerald was to become the Society’s President.
While Northern Ireland had stopped using STV by the end of the 1920s, it was reintroduced in 1973, and has been in place for almost all elections since – offering the political pluralism needed for a diverse and multi-community polity.
Devolution and the ERS
In recent years, the Society has adapted to reflect the transfer of powers to the nations within the UK. With offices in Scotland and Wales since 2006 and 2008 respectively, the ERS has played a key role in shaping the fast-changing nature of democracy in those nations as well as within England, where devolution provides opportunities to do democracy differently.
The Society has recently renewed its mission, with a commitment to achieving: fair, proportional voting for all public elections, deepening public involvement to enable democratic participation at all levels of decision-making, and winning key reforms from votes at 16 to promoting gender diversity in politics, something Northern Ireland made great strides in last year.
The development of devolution and power-sharing in Northern Ireland during the past decade has opened a new window for pro-democracy organisations and NGOs to work with parties and civil society groups in the region.
Involvement in NI
Over the past year, the ERS has been liaising with partners in the region to scope out opportunities for supporting democracy and promoting positive reforms for NI citizens.
Immediately after the 2016 Assembly election, the Northern Ireland Assembly Election Study 2016 team (John Coakley, John Garry, Neil Matthews and James Tilley) commissioned Ipsos MORI to gather data from thousands of respondents – over 4,000 – to create the largest ever survey database of voting patterns in Northern Ireland. Nearly 2,500 filled out mock ballot papers reflecting how they voted in their constituencies, allowing for a highly rigorous look at how they expressed their preferences under the STV system.
We were pleased to facilitate the publication of the team’s analysis of how STV was used in the 2016’s Northern Ireland Assembly election.
The findings
What this shows is that people do make use of the voting system – most people cast at least three preferences, with the ‘average’ voter ranking 3.4 candidates. First Past the Post (FPTP) – used for Westminster and local elections in England and Wales – does not allow any ranking whatsoever, limiting voter choice and creating mountains of wasted votes (and in turn, voter disillusionment).
The findings show that there is still some way to go before people vote ‘cross-bloc’ – i.e. for parties not of their communities. Around 80% of voters cast a first preference for parties from their own community. But there are some signs of hope when it comes to breaking down community divisions in terms of how people vote.
17% of Protestants and 20% of Catholics first preference a ‘centrist’ (i.e. cross-community) party – votes which would most likely not result in Stormont representation under a First Past the Post system.
And while just a small number, 4% of Catholics and 2% of Protestants first preference an ‘opposite’ bloc party – what is likely to be their vote under FPTP – the picture is more diverse and interesting further down the ballot.
8% of preferences expressed by Catholics are for a unionist party at some point on their voting paper, and 6% of preferences by Protestants are for a nationalist party. Cross-community parties win 18% of Protestant preferences, and the figure is 25% for Catholics.
Overall, 21% of all Northern Irish voters express some preference for a cross-community party – again allowing a possibility for ‘crossing the divide’ that would be far more difficult under the majoritarian, winner-takes-all nature of FPTP.
STV therefore allows cross-community preferences to be expressed where this wouldn’t happen under FPTP – adding both more diversity and openness to Northern Irish politics as well as feeding through into cross-community representation in Stormont.
And while about two thirds (68%) of preferences were for candidates from the ‘big four’ parties (DUP, SF, UUP, SDLP), it means there is a significant proportion that weren’t. This is a window for diversity that simply wouldn’t be there without Northern Ireland’s proportional voting system.
What next
The ERS will be looking closely at these findings and the 2017 election – the results, the voting, and the aftermath – to see what role we can play in championing the deepening of democracy in Northern Ireland. Political uncertainty is no reason for political quietism, but the complexities of contemporary politics do demand a patient understanding, exemplified by the rigour and nuance of this report.
For all those who follow politics, this study is a fascinating insight into voting habits in Northern Ireland, that goes far beyond the usual analysis that solely looks at the end results or just first preferences. What we’ve discovered is that STV opens the door for a more open and less divided politics. Voters aren’t yet using it to the fullest extent – but the opportunity is there for it to grow.
Introduction
Single Transferable Vote in action
The Proportional Representation – Single Transferable Vote (PR-STV) electoral system gives people the capacity to vote in a very flexible and nuanced manner. People are presented with a list of candidates and are invited to rank them. Voters can simply pick their most favoured candidate, if they wish, and not indicate any further preferences, or they can rank every candidate on the list.
The reasons for ordering a particular number of candidates and the ranking of those candidates can vary. Candidate qualities might be most important. For example, some people might give preferences only to candidates from their local area. Alternatively, party might be most important. Voters might give preferences only to their favourite party, for instance ranking the three candidates standing for this party 1, 2 and 3, ignoring all other candidates. Or, they might be attracted to two parties. In this case they might rank candidates from their favourite party first, and then move on to the candidates from their second favourite party, again ignoring all other candidates.
Another possibility is that policy might be most important, with some voters driven by particular ideological views. Someone who is socially liberal might give high preferences to socially liberal candidates, irrespective of which party they are from, and ignore all the candidates they believe are socially conservative. In theory, PR-STV potentially affords a lot of power to voters to express their preferences.
In this report, we examine how voters use the PR-STV system in practice in a deeply divided society. We focus on the Northern Ireland case, and on the 2016 Northern Ireland Assembly election in particular. We are particularly interested in voting patterns ‘below the surface’. It is widely known that Catholics typically cast a first preference vote for nationalist parties and Protestants typically cast a first preference vote for unionist parties. Usually, when analysing elections in Northern Ireland, commentators focus on first preference vote choice. If this is the starting point, then the ‘Catholics vote for nationalists’ and ‘Protestants vote for unionists’ story is not just the front page news, it is all the news. This means that voting across the divide is often seen as of little interest. The focus is thus typically on intra-bloc voting, effectively treating Protestants and Catholics as belonging to separate party systems.
However, voting in a PR-STV system amounts to much more than deciding on first preference vote choice, and is rather more demanding than the ‘first past the post’ plurality voting system. A first preference vote is not the same as a categorical party choice; it entails ranking, and lower preferences matter. Such ranking allows us to look at ethnonational voting in a more nuanced way. Put simply, voting below the surface level (a second preference vote and beyond) may be significantly different from the surface level (a first preference vote). Knowing the extent to which voters stray outside ethnonational lines in ranking candidates in deeply divided societies is important. It tells us about the political currents that flow beneath the surface.
This report asks two important questions. First, to what extent do people make use of PR-STV to actually cast lower preferences? Second, do voters engage in anything that could be described as cross-bloc voting? Addressing these two questions allows us to paint a full and comprehensive picture of how people vote in Northern Ireland. The answers tell us much about contemporary Northern Irish politics, but also about the potential of this particular electoral system in a deeply divided context. PR-STV is not widely used in the world, but it is often discussed when the issue of electoral reform is on the agenda. In the context of deep sociocultural division, institutional design is particularly crucial and there is a heated debate about the role of electoral systems. Our aim is to use novel high quality data to present some basic facts about how exactly the system is used and the nature and prevalence of cross-bloc voting in Northern Ireland.
Our report is organised as follows. Chapter 1 sets the 2016 Northern Ireland election in its political context, describing the campaign and the main issues at play, and giving a concise account of the results of the election. Chapter 2 then provides an empirical account of the use of the voting system: the extent of ‘outside bloc’ and of ‘cross bloc’ voting, and the manner in which this varies across ethnonational communities. In the conclusion we discuss the implications of these findings for our understanding of current Northern Ireland politics and also for the potential usefulness of PR-STV in a deeply divided country. These findings are relevant for advocates of STV, but possibly also for its opponents. We do not set out to either promote or oppose the PR-STV system. We merely wish to present an accurate portrayal of how exactly it is used in one well known example of a deeply divided society.
Northern Irish Party System
Unionists
- DUP Democratic Unionist Party
- UUP Ulster Unionist Party
- TUV Traditional Unionist Voice
- UKIP United Kingdom Independence Party
- PUP Progressive Unionist Party
- NIC Northern Ireland Conservatives
Centre / Cross-community
- APNI Alliance Party
- GPNI Green Party in Northern Ireland
- PBPA People Before Profit Alliance
- NILRC Northern Ireland Labour Representation Committee
- Ind Independents
- Other
Nationalist
- SF Sinn Féin
- SDLP Social Democratic and Labour Party
The 2016 Assembly Election
The background
For some observers the 2011-16 Northern Ireland Assembly mandate was most noteworthy for the simple fact that the devolved institutions at Stormont continued functioning for the full five-year term. Relations between the Executive parties, particularly between the Democratic Unionist Party (DUP) and Sinn Féin, were strained throughout, and on several occasions power-sharing in Northern Ireland appeared to be in crisis.
The rancour at Stormont was in large part triggered by a decision taken by Belfast City Council in December 2012 to restrict the flying of the Union flag on public buildings. In response, loyalists and unionists staged a prolonged series of protests across Northern Ireland. This focus on a highly charged ethnonational issue served to undermine the already difficult DUP and Sinn Féin ‘working relationship’ and decision-making at the heart of government effectively ground to a halt. In an attempt to break the impasse the Executive invited American diplomats Richard Haass and Meghan O’Sullivan to chair inter-party talks, commencing in late September 2013. As well as flags and emblems, the diplomats’ ‘to-do-list’ included forging agreement on the regulation of parades and dealing with the legacy of conflict in Northern Ireland.
The Haass-O’Sullivan talks process ultimately ended in failure, with the parties unable to reach agreement by the end-of-year deadline imposed by the interlocutors. With the political impasse continuing for much of 2014, DUP First Minister Peter Robinson called for a new round of negotiations, declaring Stormont ‘no longer fit for purpose’ (BBC News, 2014). Seeking to prevent the institutions from collapsing, the British and Irish governments intervened and jointly convened fresh inter-party talks. The result of these talks was the Stormont House Agreement of December 2014, which provided a tentative framework for resolving the key ‘green and orange’ issues, as well as those of institutional and welfare reform.
Any optimism in the wake of that agreement, measured though it was, was punctured by two critical developments. First, Sinn Féin blocked the passage of the Welfare Reform Bill through the Assembly, arguing that it did not provide sufficient protection for the most vulnerable in society. In response, the DUP challenged Sinn Féin’s ‘dishonourable and ham-fisted’ understanding of the Stormont House Agreement terms and warned that failure to implement the new welfare reform measures would result in a £500m shortfall in the Executive’s budget (BBC News, 2015).
Second, trust between the parties all but evaporated when the Police Service of Northern Ireland (PSNI) announced a suspected link between the murder of a prominent republican and the Army Council of the Provisional Irish Republican Army (IRA) in August 2015. The prospect of a still active IRA prompted the Ulster Unionist Party (UUP) to withdraw its sole minister from the Executive and to demand that Sinn Féin reaffirm its commitment to the democratic process. The UUP also invited the DUP to consider its own position in a power-sharing Executive with Sinn Féin. In response, Sinn Féin stated that the IRA was ‘gone and not coming back’ (Sinn Féin, 2015) and the DUP prevented the Executive from holding a meeting through a ‘resign and replace’ tactic for its ministers.
With power-sharing at a standstill and the institutions seemingly close to suspension, a new series of cross-party talks was announced, overseen again by the British and Irish governments. Following ten weeks of negotiations, the DUP and Sinn Féin eventually signed the ‘Fresh Start’ Agreement in November 2015. The new agreement contained changes to the implementation of welfare reform to assuage Sinn Féin and a new set of principles against paramilitarism to assuage the DUP. With the other Executive parties—the UUP, SDLP and Alliance—critical of the deal, the DUP and Sinn Féin entered the 2016 election with a renewed sense of partnership.
The campaign
The DUP entered the campaign with a new leader, Arlene Foster, who replaced Peter Robinson in January 2016. The first woman to hold the position of First Minister and popular with the unionist grassroots, Foster was central to the DUP’s campaign strategy. DUP candidates were ‘Arlene’s candidates’; the manifesto amounted to ‘Arlene’s five-point plan for Northern Ireland’, and the party slogan was ‘Keep Arlene as First Minister’. This slogan was widely interpreted as both a rallying cry and warning for unionist voters. A vote for the DUP would, the slogan implied, guarantee a unionist First Minister, denying Sinn Féin the ‘top spot’ as a result (this is because of the legal provision that entitles the leader of the largest party to designate the First Minister). Labelled a sectarian ‘dog-whistle’ by their political opponents, DUP representatives reinforced the message in often more explicit terms. Deputy leader Nigel Dodds warned that the prospect of Sinn Féin’s Martin McGuinness emerging as First Minister in the wake of a split unionist vote would be ‘a seismic shock to politics in Northern Ireland and a devastating blow to unionism’ (Dodds, 2016).
For its part, Sinn Féin made no secret of its desire to see Martin McGuinness returned as First Minister. However, the party stressed that, in any case, the role was substantively equal to that of deputy First Minister. In terms of policy, Sinn Féin’s manifesto bore a remarkable similarity to that of the DUP. Pledges to invest an extra £1 billion in health care and create 50,000 new jobs, to cite just two examples, were identical to those of its unionist counterpart. Launching the party manifesto, Martin McGuinness played up the synergy, calling it ‘a clear indicator to people … that at least we and the DUP are getting our act together’ (McDonald, 2016). A direct outworking of the Fresh Start agreement, such policy harmonisation was therefore designed to bolster the notion that only the DUP and Sinn Féin could provide stable, effective government in Northern Ireland.
The UUP accused the DUP and Sinn Féin of ‘arrogance’ for framing the election as a mere two-horse race (Manley, 2016). Declaring his own ambition to be First Minister, UUP leader Mike Nesbitt put education at the heart of the party’s manifesto, vowing to promote integrated education and introduce a new transfer system for primary school pupils (UUP, 2016).
The SDLP’s flagship campaign announcement also focused on social policy. Party leader Colum Eastwood announced plans to give all newborn children a £500 payment towards future savings, in an attempt to combat child poverty levels in Northern Ireland (SDLP, 2016). Elsewhere, the cross-community Alliance Party repeated its long-held stance that sectarian divisions are frustrating Northern Ireland’s full economic and social potential (Alliance, 2016).
For the first time in an Assembly election parties faced a new strategic consideration. As part of the institutional reforms, the DUP and Sinn Féin committed themselves to legislating for an official opposition at Stormont. With the Assembly and Executive Reform (Assembly Opposition) Bill passed just before dissolution, parties entitled to enter government under the d’Hondt formula could now choose to enter an official opposition instead. Neither the SDLP, UUP nor Alliance opted to state unequivocally that they would avail of this new arrangement, with such ambivalence persistently seized upon by the DUP and Sinn Féin throughout the campaign.
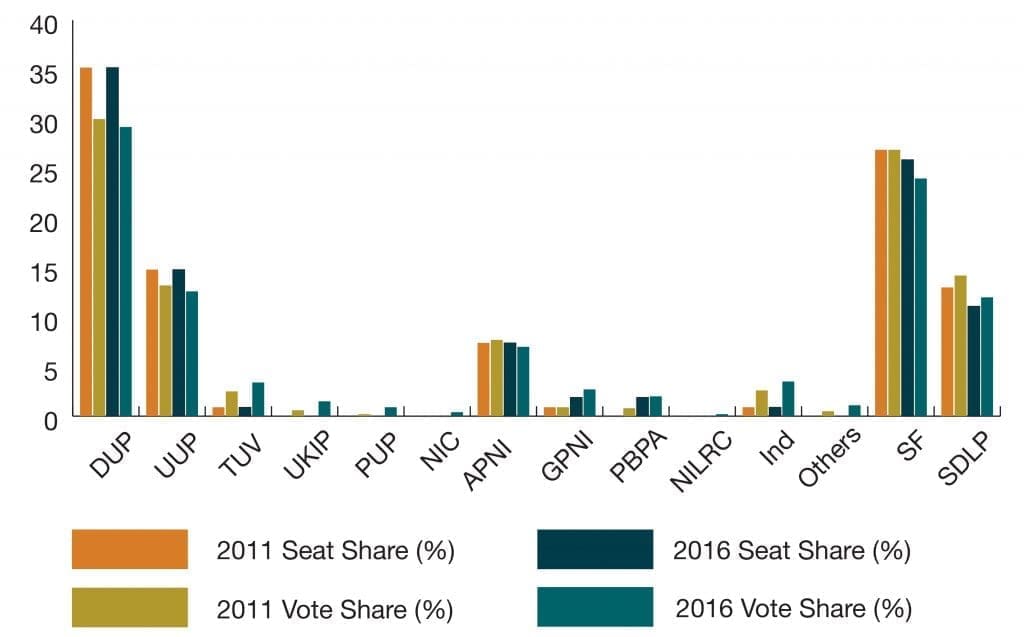
Table 1: Northern Ireland Assembly Election Results, 2016 and 2011
Source: Electoral Office for Northern Ireland, http://www.eoni.org.uk/
The results
The 2016 election brought little in the way of change at Stormont, with the dominance of the DUP and Sinn Féin over their respective ethnonational rivals undiminished. The DUP in particular enjoyed a remarkably successful election. Even with a drop in its first preference vote share, the party matched its 2011 tally of 38 seats (see Table 1 for percentage distributions). Such an outcome confounded widely held expectations that the party would sustain some losses, with 38 seats considered a non-replicable high water mark. As in previous contests, the party’s adroitness at vote management under the PR-STV electoral system was exemplary: 86 per cent of DUP candidates were elected, a figure that also accounts for a head-to-head contest between two rival DUP candidates in Mid Ulster.
DUP success meant inevitable disappointment for the UUP. By only matching its 16-seat haul from 2011, the party failed to make the inroads into the unionist vote that many, including Mike Nesbitt, had predicted. Indeed, the UUP recorded its lowest ever vote share (13.2 per cent), down 0.7 percentage points from 2011. Despite some individual success stories—including Nesbitt’s topping of the poll in Strangford—the election, therefore, failed to constitute serious progress for the party. While its decline at Assembly level as measured by seat share may have been arrested, the UUP ‘comeback’ was checked by a resolute DUP.
Table 2: Northern Ireland Assembly Election Results, By Bloc, 2016 and 2011

On the nationalist side, Sinn Féin enjoyed a curious election. Its drop in vote share (by 2.9 percentage points) was the largest suffered by any of the five outgoing Executive parties. Still, the party secured 28 seats, a loss of only one from 2011. The decline needs to be seen in context. The party was operating at a high level of success—its 29 seats of 2011 were as much a high water mark as the DUP’s 38. The assessment of many observers, however, was that a decline in vote share—itself set against the background of a larger slump in the overall nationalist vote (see below)—constituted cause for concern for the party. The 2016 Assembly election was the first in which Sinn Féin failed to record any gains, in either votes or seats. For a party that has sought to frame electoral gains as an integral facet of a wider process of sustained and relentless progress towards Irish reunification these losses were arguably significant (see Mitchell, 2015: ch. 4). Perhaps most importantly, in the short term, Sinn Féin’s failure to reach the target of 30 seats deprived it of the power to unilaterally veto legislation in the Assembly via a petition of concern.
Sinn Féin’s modest setbacks paled in comparison to the continued electoral decline of its principal nationalist rival, the SDLP. From an already very low base of 14, the SDLP lost two seats and experienced a 2.2 percentage point drop in vote-share. Perhaps the starkest indication of the SDLP’s malaise at the polls came with the prospect (seriously countenanced in the early stages of the count) that it might even fall below the threshold for a place in the Executive under d’Hondt. Some close-run victories in several constituencies spared the party the ignominy of being forced into opposition. Despite this, 2016 represented yet another electoral nadir for the SDLP.
As with the other outgoing Executive parties, the Alliance Party saw a decline in its share of the vote, down 0.7 percentage points from 2011. The party’s seat-share, however, remained unchanged at eight—a final tally which left it ineligible for a place in the Executive. The long-awaited electoral breakthrough for the cross-community party, therefore, once again failed to materialise. Again, too, Alliance’s support base was concentrated almost exclusively in eastern and predominantly unionist constituencies.
Losses for the five main parties were offset by gains for the smaller parties and independent candidates in Northern Ireland. The biggest beneficiary was the People Before Profit Alliance (PBPA) whose 2 per cent vote share translated into two seats. Such success, which included Gerry Carroll topping the poll in Belfast West, was interpreted as a protest vote from previously loyal Sinn Féin supporters over its acceptance of welfare reform measures. Elsewhere, the Green Party boasted the biggest vote share increase of any party (1.8 percentage points), winning seats in Belfast South and North Down. Independent candidate, Claire Sugden, confounded many pundits by holding on to the East Londonderry seat she inherited in 2014. The Traditional Unionist Voice (TUV) failed to turn a 0.9 per cent vote increase into a seat gain, with its leader, Jim Allister, remaining the party’s sole Assembly member.
Of the remaining parties, the UK Independence Party (UKIP) saw its vote share more than double, from 0.7 per cent in 2011 to 1.5 per cent. However, the party failed to win a seat. The Progressive Unionist Party (PUP) suffered a similar fate. Despite an increase in its share of the vote, up 0.6 percentage points from 2011, the party failed to gain representation in the Assembly. The Northern Ireland Conseratives (NIC) and the Northern Ireland Labour Representation Committee (NILRC) — the latter contesting the election without the approval of the British Labour Party—secured respective vote shares of 0.4 and 0.2 per cent. Such low returns demonstrate the enormous challenges faced by the main British parties in making any credible electoral progress in Northern Ireland.
Overall turnout in the 2016 Assembly election was 54.9 per cent. Down 0.8 percentage points on the 2011 Assembly election, this was the lowest turnout in Northern Irish electoral history. In a wider UK context, with elections also taking place on May 5 for the Welsh Assembly and Scottish Parliament, Northern Ireland was the only region to record an increased level of voter apathy. Another notable feature of the turnout concerned the difference in communal support. The overall unionist vote was 51.5 per cent, up 3.2 percentage points on 2011 (see Table 2). In stark contrast, turnout was down in all nationalist-majority constituencies, especially westerly ones, leaving the new Assembly with its lowest nationalist representation since 1998 (40 seats). The combined Sinn Féin-SDLP vote fell by 5.1 percentage points to 36 per cent.
How Voters used STV
The data
The data with which we propose to address the key questions outlined in the introduction were generated by a major survey conducted across Northern Ireland immediately after the 2016 Assembly election (the total number of respondents, both voters and non-voters, was 4,043)^. In addition to other information that we collected about their characteristics, respondents were invited to complete a mock ballot paper that exactly reproduced the ballot paper used in the constituencies within which they were entitled to vote. In total, 2,336 voters filled out our ballot paper from all of Northern Ireland’s 18 constituencies. We use this dataset to answer our two key questions. First, how does STV operate in Northern Ireland, as regards the willingness of voters to maximise the impact of their votes? Second, to what extent are people prepared to cross the community divide with their lower preference votes?
^(The survey was conducted by Ipsos MORI, who employed a two stage approach to implementing a stratified random location design—based on randomly selected Output Areas (OAs), with demographic quotas to reflect the profile of each OA within each area of interest. The quotas set ensured that we achieved a representative sample of the Northern Ireland population aged 18+ in terms of gender, age and social class and with the 250 sample points across Northern Ireland we achieved a representative spread geographically. Face to face, in-home, CAPI Interviewing commenced on Friday 6th May, the day immediately following the 2016 Northern Ireland Assembly Election. Over two thirds of the target number of interviews (2,817) were completed before the end of June, with the remaining interviews (1,226) completed in July. The large number of respondents in our survey allows us unprecedented ability to analyse lower preference voting, hence providing a unique insight into the use of STV in Northern Ireland. Consistent with previous survey research, our survey somewhat over-represents voters rather than non-voters (66 per cent stated that they voted compared to the real turnout of 55 per cent). Also, in line with previous Northern Ireland surveys, Sinn Fein support is somewhat under-represented (17 per cent compared to 24 per cent) and support for Alliance is slightly over-represented.)
How voters use the ballot
Our first question concerns voters’ willingness to exploit the full potential of the STV system by ranking all candidates. There are cases where exhaustive ranking is mandatory: in elections to the Australian Senate, for instance, only the votes of voters who have ranked all candidates are considered valid, and this provision applies also to the House of Representatives^. Where there is no mandatory ranking requirement, it is still possible for voters to maximise their impact on the election by exhausting their preferences: by ranking not just favoured candidates, but also by placing least favoured ones at the bottom of the ranking list.
^(Elections to the Australian Senate are by STV and to the House of Representatives by the Alternative Vote; in both of these cases ‘above-the-line’ or ‘ticket’ voting has simplified voter choice in recent elections.)
Table 3: Ranking of Candidates
| Number of candidates in constituency |
Mean number of preferences |
Median number of preferences |
Percent expressing at least three preferences12 |
| 12 |
3.2 |
3 |
66.7 |
| 13 |
3.0 |
3 |
55.6 |
| 14 |
3.5 |
3 |
71.5 |
| 15 |
3.4 |
3 |
65.2 |
| 16 |
3.5 |
3 |
72.5 |
| 17 |
3.6 |
3 |
66.7 |
| 18 |
3.4 |
3 |
72.5 |
| all (12-18) |
3.4 |
3 |
66.7 |
Source: NIAS voter survey 2016
In practice, the typical voter appears to be reluctant to rank all the candidates. Table 3 shows the pattern in our survey in respect of Northern Ireland’s 18 six-member constituencies. The constituencies are grouped according to number of candidates, ranging from 12 to 18. However, voters typically do not cast more than about three votes. As Table 3 shows, the mean number of preferences expressed across constituencies ranges from 3.2 to 3.6, with a median of 3 in all constituencies. While there is a slight tendency for voters to go further down the ballot in constituencies with more candidates, this is not very marked.
There are two ways in which we can compare the Northern Ireland pattern in this respect with other STV systems. First, the mean number of preferences expressed in our survey (3.4) is comparable with the finding in surveys in the Republic: an Irish election survey in 2002 (3.9; Marsh et al, 2008: 19), a nation-wide poll at the time of the 1989 European Parliament election (3.3), and a constituency poll in Galway West in 1986 (3.2; Bowler and Farrell, 1991: 2010). We also have some data from actual ballot papers: for three constituencies in the Republic in the general election of 2002 (where the mean number of preferences expressed ranged from 4.4 to 5.0, somewhat higher than the Northern Ireland figures reported here; Laver, 2004). In the first Scottish local elections to take place under STV, those of 2007, analysis of actual ballot papers showed that the mean number of candidates that were ranked ranged from 3.1 to 3.2 (Denver et al., 2009).
The second way to look at voters’ disposition to rank candidates is to consider the percentage expressing at least three preferences. Over all constituencies, this was 69 per cent. This is comparable with the figure for the 2012 Scottish local elections, where 65 per cent ranked three or more candidates in the 2012 local elections in constituencies where there were at least 11 candidates (Curtice, 2012: 15; see also Clark, 2013). There is some evidence that this figure is higher than the corresponding one in 2007, suggesting that there may have been a learning process (the measure in 2007 was slightly different: the median percentage casting three or more preferences in all constituencies, 55 per cent; computed from Baston, 2007: 69; see also Curtice, 2007).
Overall, the pattern of preference voting reported here for Northern Ireland is broadly in line with what we know of electoral behaviour in other comparable cases, whether based on the completion of mock ballot papers or on electronic voting. Our data differ from those visible in the Irish general election of 2002 in the three constituencies where electronic voting was used, but it is this particular experience—rather than the Northern Ireland case—that seems to be atypical. We might trace the difference between the Scottish and Irish experiences back to a simple technical fact: voting in the Scottish local elections was by means of traditional printed ballot papers, which were then scanned and counted electronically; the Irish experiment was one of ‘true’ electronic voting, with voting machines perhaps making it easier for voters to rank further down the line.
The Northern Ireland patterns of using the ballot are also very similar for Protestants and Catholics. A question on the religion in which respondents were brought up allowed us to divide voters into three categories: those of a Protestant background (56 per cent), those of a Catholic background (40 per cent) and others, including non-respondents (4 per cent).
Table 4. Ranking Candidates by Community Background, 2016
Source: NIAS voter survey 2016. Note: figures are percentages.
Table 4 shows the pattern of use of preferential voting in a different way. Here we indicate the percentage who reported having plumped for a particular candidate (expressing only one preference; 14 per cent), who have ranked two (17 per cent), and so on. As Table 4 shows, few people ranked more than a handful of candidates and indeed about two thirds of people did not go beyond the third place on the ballot paper.
In this table we also break the pattern of transfers down by community background. This suggests that members of both major communities vote down the line in a similar manner. If anything, Protestants seem slightly more disposed than Catholics to exploit the potential of ranking a large number of candidates: 38 per cent of Protestants expressed four or more preferences, but the proportion of Catholics doing so is lower, at 30 percent (see Table 2 in the Appendix). There is an obvious possible explanation for this as there were fewer nationalist candidates than unionist candidates. In the case of those wishing to confine their support to their own community, Protestants would have a larger range of choice than Catholics, so we might expect them to express a larger number of preferences.
Overall, however, these differences are small. No matter what someone’s constituency or ethnonational background is, he or she is very unlikely to use the full ballot, and a typical person is likely to only cast a preference for three candidates.
Community background and prefernces
Our second big question is whether Protestant and Catholic voters in 2016 had distinctive preferences. Table 5 shows that distinctiveness in respect of first preferences. The three panels in this table correspond to the three major party ‘blocs’ that dominate Northern Irish politics: unionists in the top panel, nationalists in the bottom panel, and ‘others’ in the middle. As the first column shows, Protestants continue overwhelmingly to give first preferences to unionist parties, with only 2 per cent giving first preferences to nationalist parties. This is reciprocated on the Catholic side, where support for the two main nationalist parties is equally overwhelming, with only 4 per cent giving a first preference to one of the unionist parties. About a fifth of both Catholics and Protestants give their first preference to the political centre^.
^(Here, we have classified People Before Profit Alliance as centrist, even though its historical origins and its support base link it with the Catholic Community; it projects itself strongly as a cross-community party, and its members of the Assembly are designated as “other” rather than as unionist or nationalist.)
Table 5: First Preferences by Community Background, 2016
| Party |
Protestant
|
Catholic
|
Other
|
Total
|
|
DUP
|
48%
|
2%
|
7%
|
28%
|
|
UUP
|
21%
|
1%
|
15%
|
13%
|
|
TUV
|
4%
|
0%
|
3%
|
2%
|
|
UKIP
|
3%
|
1%
|
3%
|
2%
|
|
Other unionist
|
4%
|
1%
|
2%
|
3%
|
|
(All Unionist)
|
81%
|
4%
|
30%
|
48%
|
|
|
|
|
|
|
|
APNI
|
11%
|
7%
|
31%
|
10%
|
|
GPNI
|
4%
|
3%
|
13%
|
4%
|
|
PBPA
|
0%
|
7%
|
0%
|
3%
|
|
Ind
|
2%
|
3%
|
6%
|
3%
|
|
(All Centre)
|
17%
|
20%
|
51%
|
19%
|
|
|
|
|
|
|
|
SF
|
1%
|
41%
|
11%
|
17%
|
|
SDLP
|
1%
|
34%
|
8%
|
14%
|
|
Other nationalist
|
0%
|
2%
|
0%
|
1%
|
|
(All Nationalist)
|
2%
|
76%
|
19%
|
32%
|
|
|
|
|
|
|
|
No. of cases
|
1,313
|
934
|
89
|
2,336
|
Source: NIAS voter survey 2016. Note: figures are column percentages except for those in the bottom row.
Table 6: All Preferences by Originating Party and Community Background, 2016
| Party |
Protestant
|
Catholic
|
Other
|
Total
|
|
DUP
|
40%
|
2%
|
13%
|
25%
|
|
UUP
|
23%
|
3%
|
12%
|
15%
|
|
TUV
|
5%
|
0%
|
3%
|
3%
|
|
UKIP
|
3%
|
0%
|
2%
|
2%
|
|
Other unionist
|
5%
|
2%
|
5%
|
4%
|
|
(All Unionist)
|
76%
|
8%
|
36%
|
50%
|
|
|
|
|
|
|
|
APNI
|
10%
|
10%
|
24%
|
10%
|
|
GPNI
|
4%
|
7%
|
12%
|
6%
|
|
PBPA
|
0%
|
3%
|
1%
|
1%
|
|
Ind
|
3%
|
5%
|
7%
|
4%
|
|
(All Centre)
|
18%
|
25%
|
45%
|
21%
|
|
|
|
|
|
|
|
SF
|
1%
|
41%
|
10%
|
16%
|
|
SDLP
|
4%
|
25%
|
10%
|
12%
|
|
Other nationalist
|
0%
|
1%
|
1%
|
1%
|
|
(All Nationalist)
|
6%
|
67%
|
20%
|
29%
|
|
|
|
|
|
|
|
No. of preferences
|
4,726
|
2,920
|
294
|
7,940
|
Source: NIAS voter survey 2016. Note: figures are column percentages, except for those in the bottom row.
In order to understand the manner in which voters express their range of preferences under STV we look globally at expressed preferences, as reported in Table 6. In all, 7,940 preferences were cast by 2,336 voters. The first three columns break this down by community background; thus 1,313 Protestant respondents expressed 4,726 preferences and 934 Catholics expressed 2,920 preferences. When we look at the extent to which lower (or any) preferences are expressed across bloc lines, the pattern is stark. Very few Protestant respondents gave any ranking to a nationalist party (only 6 per cent of preferences expressed by Protestant voters went to nationalist parties); and few Catholics passed a lower preference on to a unionist party (the corresponding figure here is 8 per cent). These low figures may well overstate the willingness of voters to support candidates from another bloc. We would expect a tactically clever voter with strong bloc loyalty to rank all candidates from his or her own bloc first, and then continue passing preferences on to the other main bloc, since doing so could not damage the voter’s own bloc. On the contrary, these lower preferences allow the voter to ‘interfere’ in the other bloc, supporting the least disliked party against the most disliked. Passing lower preferences to an opposing bloc, then, may be a sign – at least for some voters – of tactical sophistication rather than an indicator of moderate political disposition.
Conclusion
Conclusion
STV gives voters the opportunity to cast their vote not just for a single party but to indicate a whole range of preferences for different candidates and parties. While some voters do take this opportunity, there are very few people who rank anywhere near the full set of candidates. The typical voter casts three preferences and only one third of voters go any further down the ballot. Notwithstanding this rather limited use of the ballot paper, in theory people can use the system to vote for parties ‘across the divide’. Our data allows a rare insight into how people actually use their vote: do many Protestants cast a preference for a ‘nationalist’ party or Catholics give a preference to a ‘unionist’ party?
At the surface level of first preference voting, Protestants continue overwhelmingly to support unionist parties, with only 2 per cent giving first preferences to nationalist parties. This is mirrored on the Catholic side, with only 4 per cent giving a first preference to one of the unionist parties.
Below the surface, in respect of lower preferences, the picture is rather similar. It is a rarity for Protestants to give any ranking to a nationalist party (only 6 per cent of preferences expressed by Protestant voters went to nationalist parties); and almost as rare for Catholics to give a lower preference to a unionist party (8 per cent of preferences given by Catholic voters). Given that there may be at least some element of negative strategic voting at play, even these low figures may overstate the willingness of voters to support candidates from another bloc.
The 2016 Assembly election in Northern Ireland offers, then, further evidence of the highly polarised structuring of party support in that deeply divided region. Protestant and Catholic voters tend not just to give their first preference votes to nationalist and unionist parties respectively (with some exceptions just mentioned); they also tend to continue these preferences within their own political bloc rather than transferring to the rival bloc.
Nevertheless, the evidence presented here suggests that STV offers voters an opportunity, of which a modest number avail, to transfer to the political centre with their lower preferences, thus in some measure mitigating the starkness of the main line of ethnonational division.
When we look at all preferences, there is a little more support for centrist bloc voting, but it is not radically higher than for first preferences: a fifth of Protestants and a quarter of Catholics cast a preference at some point on the ballot for one of the centrist parties. It is also worth noting that Protestants stay within bloc somewhat more than Catholics (76 to 67 percent).”
John Coakley is a professor in the School of History, Anthropology, Philosophy and Politics, Queen’s University Belfast, and Professor Emeritus in the School of Politics and International Relations at University College Dublin. He has published extensively in the area of ethnic politics.
John Garry is Professor of Political Behaviour in the School of History, Anthropology, Philosophy and Politics at Queen’s University Belfast. He is author of Consociation and Voting (University of Pennsylvania Press, 2016).
Neil Matthews is lecturer in British Politics in the School of Sociology, Politics & International Studies at the University of Bristol. He has published articles on Northern Ireland politics in Parliamentary Affairs and Political Studies.
James Tilley is a Professor of Politics at the University of Oxford and a Fellow of Jesus College, Oxford. He is author of Blaming Europe? (with Sara Hobolt) and The New Politics of Class (with Geoff Evans).
References
References
- Alliance (2016) Manifesto 2016: An agenda to increase the speed of change in Northern Ireland. Belfast: APNI
- Baston, Lewis (2007) 2007 Local Authority Elections in Scotland: 3 May 2007: Report and Analysis. London: Electoral Reform Society
- BBC News (2014) ‘Peter Robinson says Stormont “no longer fit for purpose”’, available at: http://www.bbc.co.uk/news/uk-northern-ireland-29122224 (accessed 1 February 2017)
- BBC News (2015) ‘Peter Robinson: Martin McGuinness claims on welfare reform “dishonourable and ham-fisted”, available at: http://www.bbc.co.uk/news/uk-northern-ireland-31799385 (accessed 1 February 2017)
- Bowler, Shawn, and David Farrell (1991) ‘Voter behavior under STV-PR: solving the puzzle of the Irish party system’, Political Behavior 13 (4): 303—320
- Clark, Alistair (2013) ‘Second time lucky? The continuing adaptation of voters and parties to the single transferable vote in Scotland’, Representation 49 (1): 55-68
- Coakley, John (2008) ‘Militant nationalist electoral support: A measurement dilemma’, International Journal of Public Opinion Research 20 (2): 224-236
- Curtice, John (2007) ‘STV goes tartan: a preliminary analysis of its use in the 2007 Scottish local elections’, Representation 43 (3): 209-216
- Curtice, John (2012) 2012 Scottish Local Government Elections: 3 May 2012. London: Electoral Reform Society
- Denver, David, Alistair Clark and Lynn Bennie (2009) Voter reactions to a preferential ballot: the 2007 Scottish local elections, Journal of Elections, Public Opinion and Parties 19 (3): 265-282
- Dodds, N (2016) ‘Yes, it does matter who’s the next First Minister, and I don’t want it to be Martin McGuinness’, Belfast Telegraph, 27 April, available at: http://www.belfasttelegraph.co.uk/opinion/yes-it-does-matter-whos-the-next-first-minister-and-i-dont-want-it-to-be-martin-mcguinness-34663178.html (accessed 1 February 2017)
- Laver, Michael (2004) ‘Analysing structures of party preference in electronic voting data’, Party Politics 10 (5): 521—541
- Manley, J (2016) ‘Mike Nesbitt launches Ulster Unionist manifesto with hope of topping Stormont poll’, Irish News, 15 April, available at: http://www.irishnews.com/news/northernirelandnews/2016/04/15/news/mike-nesbitt-launches-ulster-unionist-manifesto-with-hope-of-topping-stormont-poll-486851/ (accessed 1 February 2017)
- Marsh, Michael, Richard Sinnott, John Garry and Fiachra Kennedy (2008) The Irish Voter: The Nature of Electoral Competition in the Republic of Ireland. Manchester: Manchester University Press, 2008
- Matthews, Neil and James Pow (2016) ‘A fresh start? The Northern Ireland Assembly election 2016’, Irish Political Studies. Electronic preprint 21 November; http://dx.doi.org.ucd.idm.oclc.org/10.1080/07907184.2016.1255202
- McDonald, H (2016) ‘SDLP fights for survival in Derry in face of Sinn Féin onslaught’, The Guardian, 3 May, available at: https://www.theguardian.com/politics/2016/may/03/sdlp-fights-survival-sinn-Féin-onslaught-northern-ireland (accessed 1 February 2017)
- Mitchell, D (2015) Politics and Peace in Northern Ireland: Political Parties and the Implementation of the 1998 Agreement. Manchester: Manchester University Press
- Russell, Raymond (2016) Election Report: Northern Ireland Assembly Election, 5 May 2016. Belfast: Northern Ireland Assembly Research and Information Service [NIAR 141-16]
SDLP (2016) Build a Better Future: SDLP Manifesto 2016. Belfast: SDLP
- Sinn Féin (2015) ‘The IRA is gone and not coming back’, available at: http://www.sinnFéin.ie/contents/36153 (accessed 1 February 2017)
- UUP (2016) Ulster Unionist Party: Northern Ireland Assembly Manifesto 2016. Belfast: UUP
Appendix
Appendix Table 1: Northern Ireland Assembly Election Results, 2016 and 2011
| Party |
2016 Seats
|
2016 Vote Share (%)
|
2011 Seats
|
2011 Vote Share (%)
|
|
DUP
|
38
|
29.2
|
38
|
30.0
|
|
UUP
|
16
|
12.6
|
16
|
13.2
|
|
TUV
|
1
|
3.4
|
1
|
2.5
|
|
UKIP
|
0
|
1.5
|
0
|
0.6
|
|
PUP
|
0
|
0.9
|
0
|
0.2
|
|
NIC
|
0
|
0.4
|
0
|
0.0
|
|
(All Unionist)
|
55
|
48.0
|
55
|
46.5
|
|
APNI
|
8
|
7.0
|
8
|
7.7
|
|
GPNI
|
2
|
2.7
|
1
|
0.9
|
|
PBPA
|
2
|
2.0
|
0
|
0.8
|
|
NILRC
|
0
|
0.2
|
–
|
0.0
|
|
Ind
|
1
|
3.5
|
1
|
2.6
|
|
Others
|
0
|
1.1
|
0
|
0.5
|
|
(All Centre)
|
13
|
16.5
|
10
|
12.5
|
|
SF
|
28
|
24.0
|
29
|
26.9
|
|
SDLP
|
12
|
12.0
|
14
|
14.2
|
|
(All Nationalist)
|
40
|
36.0
|
43
|
41.1
|
Source: Electoral Office for Northern Ireland, http://www.eoni.org.uk/
Appendix Table 2: Ranking of Candidates by Community Background, 2016
| Pref |
Protestants
|
Catholics
|
Others
|
All
|
Cumulative Percent
|
|
1
|
12.5
|
16.6
|
19.1
|
14.4
|
14.4
|
|
2
|
15.7
|
18.6
|
16.9
|
16.9
|
31.3
|
|
3
|
34.3
|
35.1
|
31.5
|
34.5
|
65.8
|
|
4
|
16.1
|
13.4
|
16.9
|
15.1
|
80.9
|
|
5
|
7.6
|
9.6
|
7.9
|
8.4
|
89.3
|
|
6
|
5.2
|
3.1
|
1.1
|
4.2
|
93.5
|
|
7
|
3.5
|
1.5
|
2.2
|
2.7
|
96.1
|
|
8
|
1.5
|
0.7
|
2.2
|
1.2
|
97.4
|
|
9
|
1.1
|
0.2
|
0.0
|
0.7
|
98.1
|
|
10
|
0.4
|
0.1
|
0.0
|
0.3
|
98.3
|
|
11
|
0.5
|
0.1
|
0.0
|
0.3
|
98.7
|
|
12
|
0.0
|
0.2
|
0.0
|
0.1
|
98.8
|
|
13
|
0.2
|
0.1
|
0.0
|
0.1
|
98.9
|
|
14
|
0.6
|
0.1
|
1.1
|
0.4
|
99.3
|
|
15
|
0.3
|
0.1
|
0.0
|
0.2
|
99.5
|
|
16
|
0.2
|
0.1
|
0.0
|
0.2
|
99.7
|
|
17
|
0.2
|
0.1
|
0.0
|
0.2
|
99.9
|
|
18
|
0.1
|
0.1
|
1.1
|
0.1
|
100.0
|
|
No. of cases
|
1,313
|
934
|
89
|
2,336
|
2,336
|
Source: NIAS voter survey 2016. Note: figures are percentages.